
The Pipeline at a glance
The National Infrastructure Pipeline (Pipeline) is New Zealand’s national dataset of infrastructure initiatives recording project and programme activity. It informs decisions on investments and activity to maintain, renew, and improve the infrastructure we all rely on. This important evidence base is updated quarterly and includes thousands of projects and programmes at various stages of planning, commitment, and delivery from central government, local government, and private sector infrastructure providers.
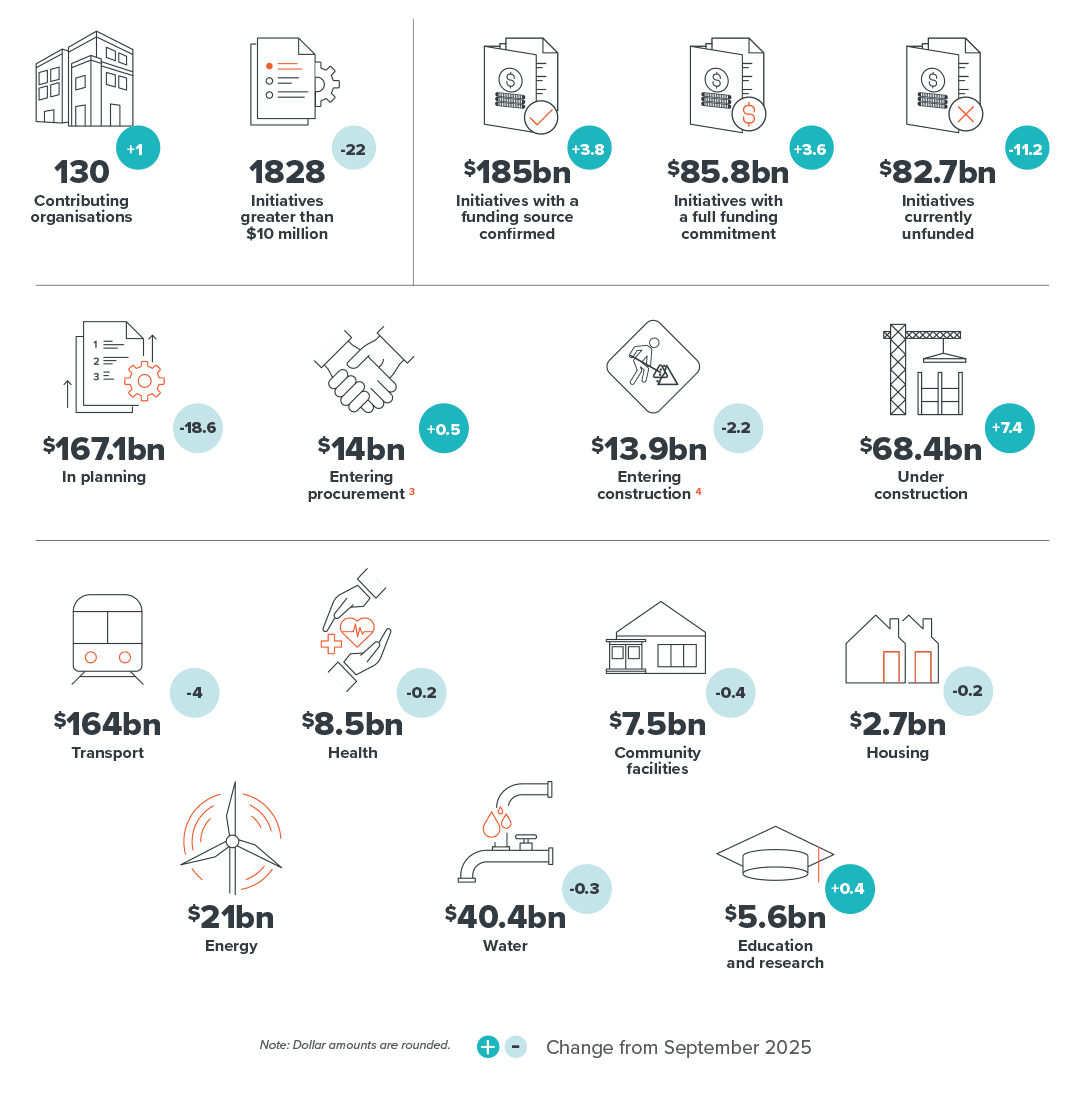
The December 2025 update shows continued movement within the Pipeline, with more initiatives securing funding and progressing into delivery. Overall Pipeline value decreased slightly due to cost updates and project completions. Key changes since September 2025 include:
-
Initiatives with committed funding or a funding source increased by $3.8 billion. Initiatives with committed funding or a confirmed funding source totalled $185 billion, up $3.8 billion from September. This includes $2.4 billion of initiatives that moved from having no confirmed funding source to having one in December.
-
Fully funded initiatives increased by $3.6 billion. The value of initiatives reported as fully funded rose by $3.6 billion, including $3.3 billion from initiatives progressing through planning to gain firm funding commitment for completion.
-
Initiatives under construction increased by $7.4 billion. Initiatives recorded as under construction totalled $68.4 billion, an increase of $7.4 billion since September, reflecting the total value of work currently being delivered.
-
Total Pipeline value decreased by $7.4 billion to $268 billion. The value of initiatives without confirmed funding sources decreased by $11.2 billion, largely due to updated cost estimates. Together with $2.5 billion of completed initiatives exiting the Pipeline and other changes, the overall Pipeline value decreased from $275.1 billion in September to $267.7 billion in December.
Download this snapshot
Pipeline Snapshot - December 2025
Download
At a glance
National Infrastructure Plan
In February, we published the National Infrastructure Plan. It sets out a practical, affordable pathway to deliver the infrastructure New Zealanders need to thrive over the next 30 years. It looks across the system, from hospitals, to roads, to water networks.
The Plan provides forward guidance on a sustainable investment path for infrastructure, insight into the investment choices and trade-offs that need to be made, and a range of recommendations to improve the infrastructure system. It combines long-term demand forecasting through our Forward Guidance with insights from the Infrastructure Priorities Programme (IPP) and the Pipeline.
The Pipeline continues to grow toward a complete picture of regional and sectoral infrastructure investment activity. Infrastructure providers yet to contribute information to the Pipeline should reach out to the Commission to learn more about providing data.
Total expected cost of initiatives with committed funding or a confirmed funding source is $185 billion
In December 2025 the Pipeline included information on over 12,0001 infrastructure initiatives underway and in planning for 130 contributors. These initiatives span projects and programmes at various stages of planning, funding commitment, and delivery.
Over 2,700 initiatives with a total expected cost of $68.4 billion were reported as under construction. Work to progress the delivery of these initiatives is projected to result in $3.6 billion of spend in the first quarter of 2026 and a further $9.4 billion of spend from April to December 2026.
Initiatives with committed funding or a confirmed funding source increased by $3.8 billion
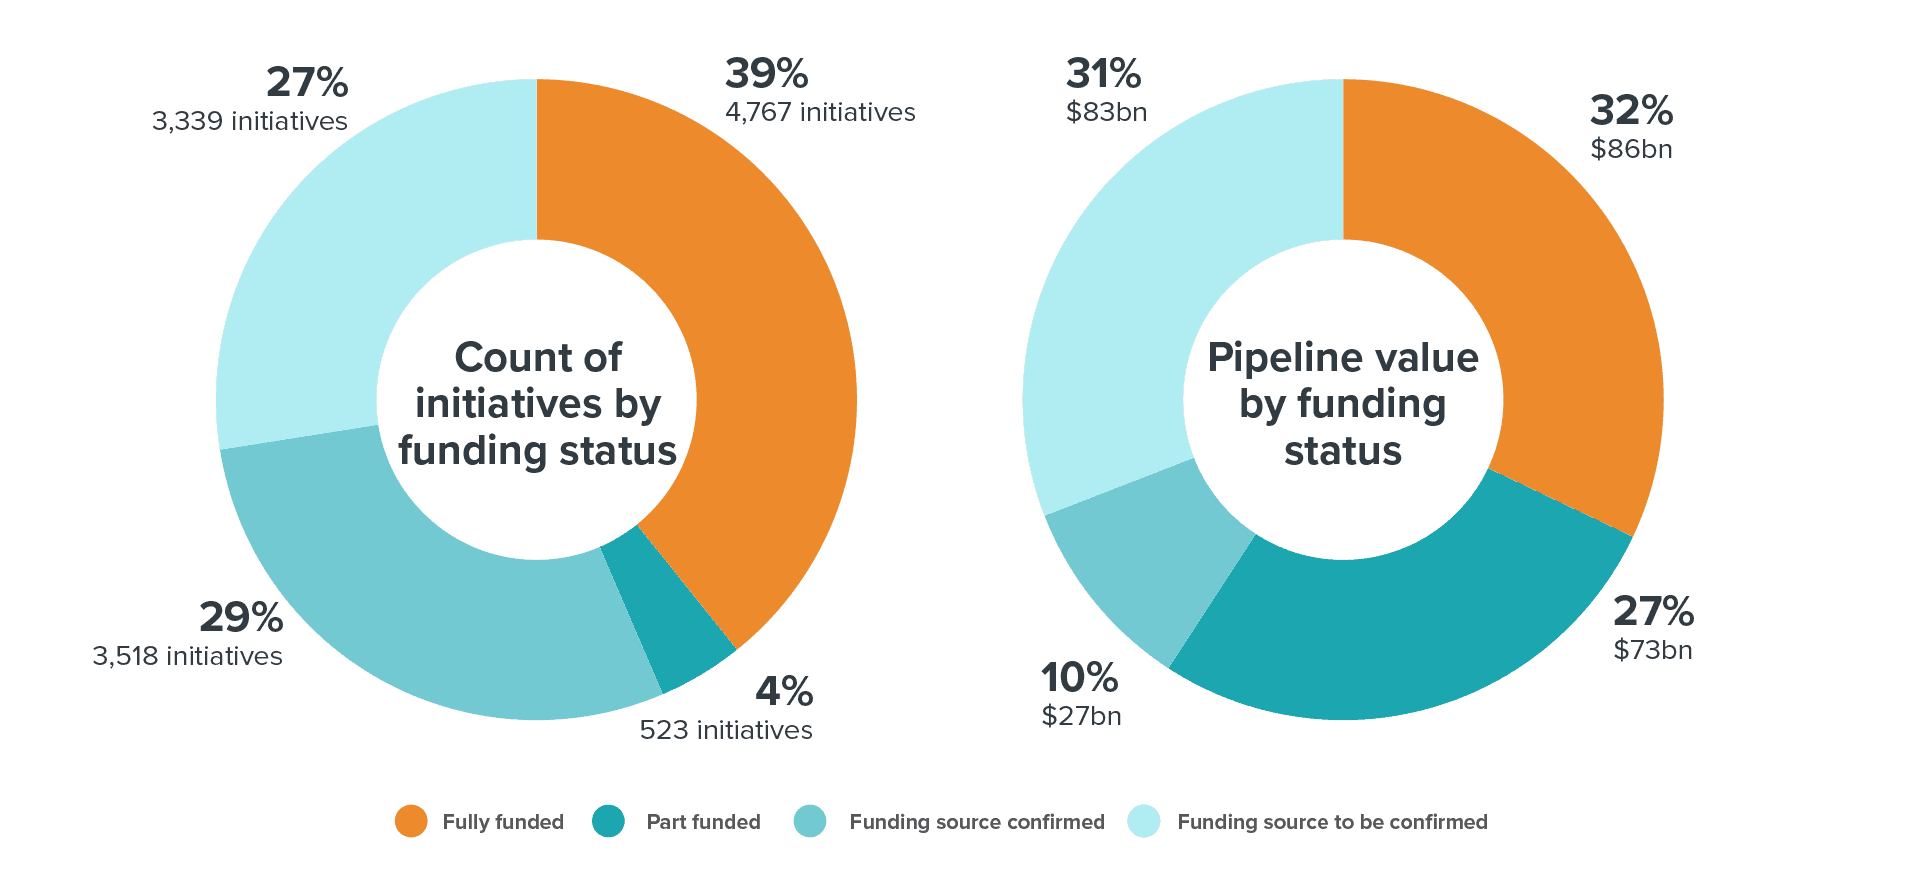
The value of initiatives reported as fully funded, part funded or with a confirmed funding source is $185 billion, an increase of $3.8 billion from September 2025. The value of initiatives without a confirmed funding source and earlier in planning is $82.7 billion, a decrease of $11.2 billion. The drivers of change are discussed later the report and shown in Figure 9.
The combined value of all Pipeline initiatives, regardless of funding status is $267.7 billion, this includes $6.8 billion of initiatives (2.5% of total Pipeline value) reported as ‘on hold’ or ‘under review’2. Figures 1 and 2 highlights the funding status for initiatives in the Pipeline.
-
Fully funded initiatives have funding commitment to complete the initiative up to an approved budget and scope (includes initiatives currently in delivery).
-
Part funded initiatives vary in the level of funding commitment, from an initial or small commitment, through to a significant (but not full) amount.
-
Funding source confirmed indicates an initiative’s future funding source is known, but funding has not yet been committed.
-
Funding source to be confirmed indicates when an initiative’s future funding source is not known or has not been confirmed.
Figure 1
$185 billion of Pipeline initiatives are funded, part funded, or have a confirmed funding source
Pipeline value and initiative count by funding status, December 2025
Smaller initiatives support a steady flow of work for the construction sector
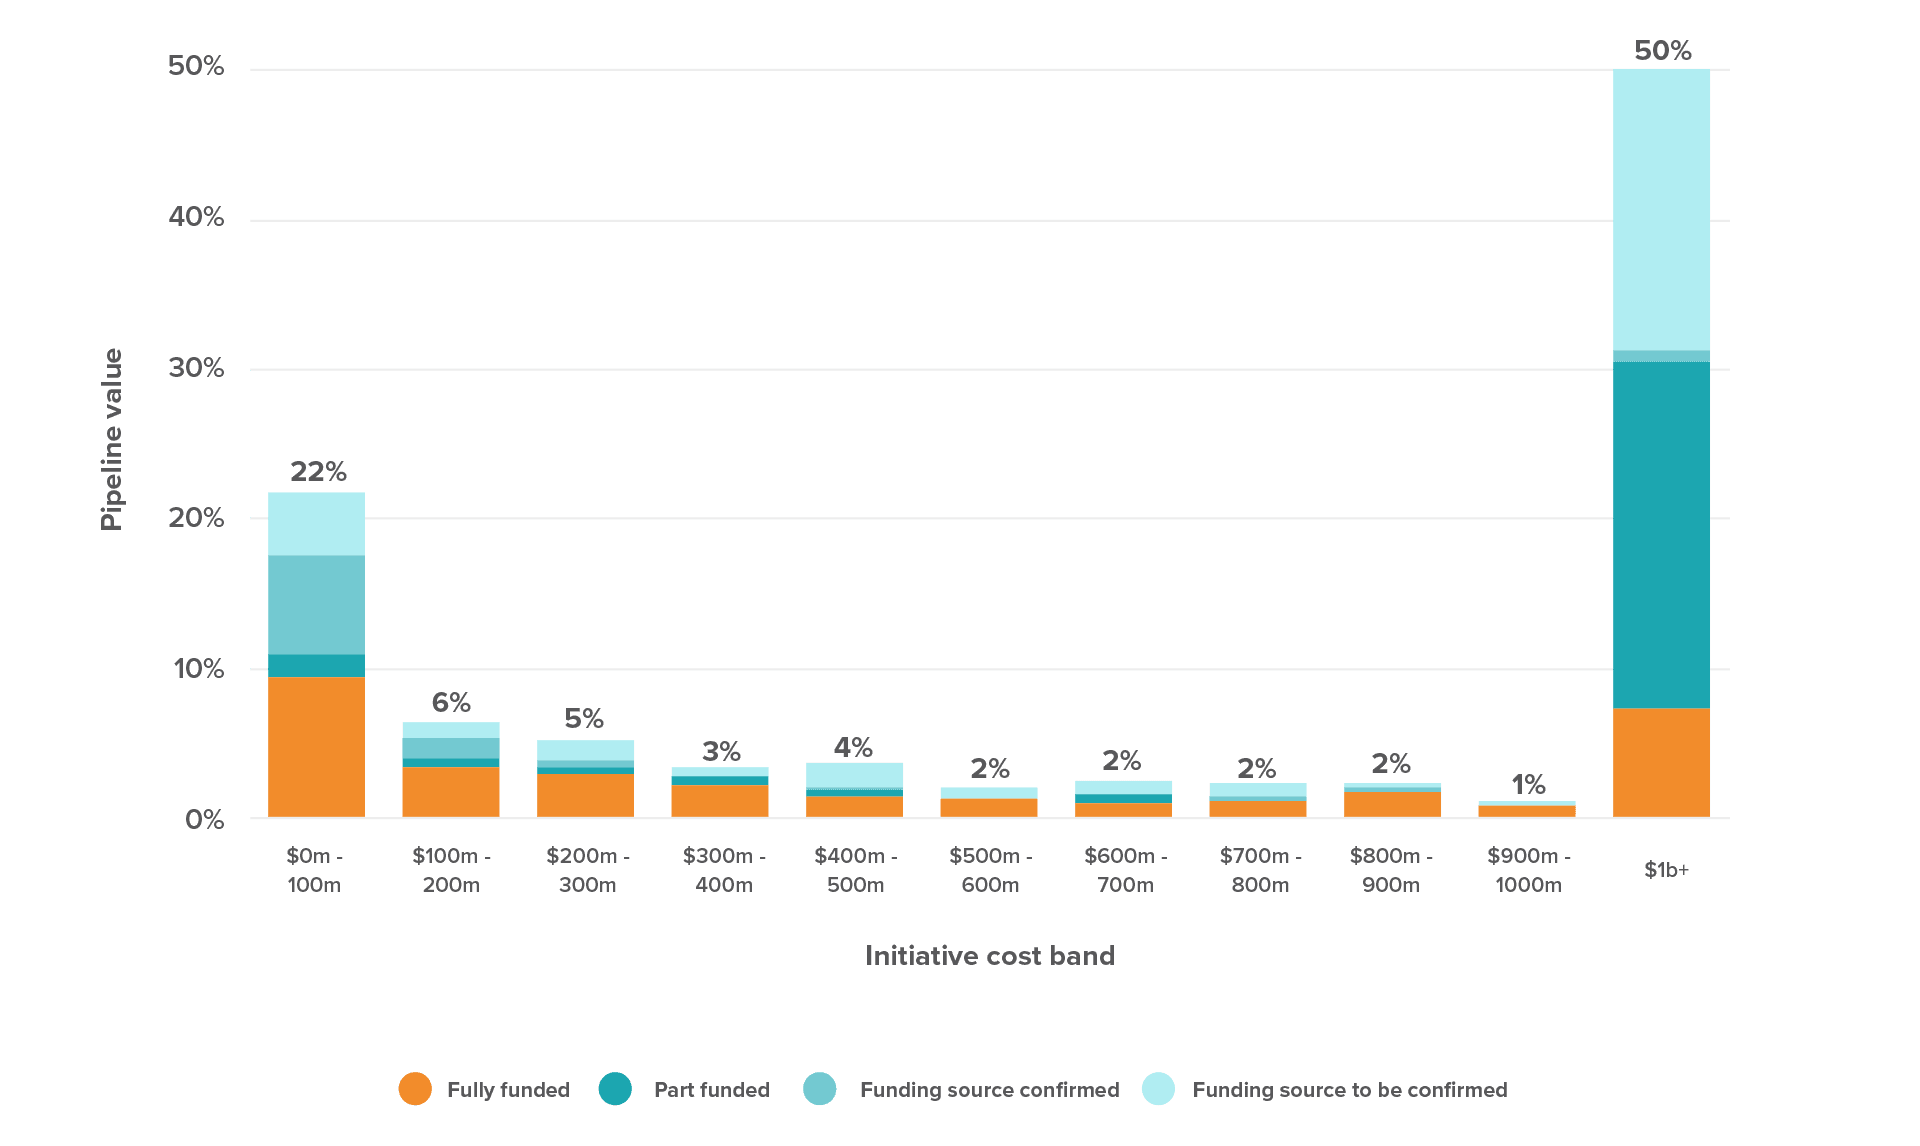
Figure 2 shows the distribution of Pipeline initiatives by cost band and funding status. The figure highlights that 22% of total Pipeline value comes from 11,840 initiatives (97% of all Pipeline initiatives), that have reported expected costs of below $100 million. Breaking this down into smaller initiatives shows that:
-
4,511 initiatives (37% of all Pipeline initiatives) have expected costs of between $1 and $25 million
-
6,718 initiatives (55% of all Pipeline initiatives) have expected costs of less than $1 million.
Smaller projects and programmes make an important contribution to stability and confidence in the forward works programme, with 72% of initiatives with an expected cost below $100 million reported as having a confirmed funding source (17% of total Pipeline value).
At the other end of the scale, the Pipeline includes 44 initiatives with an expected cost over $1 billion. While these initiatives account for 50% of total Pipeline value, many remain in early stages and represent investment choices for New Zealand.
-
Ten were reported as fully funded (7% of total Pipeline value)
-
Eighteen were reported as part funded (23% of total Pipeline value)
-
Fourteen were reported without a confirmed funding source (19% of total Pipeline value).
Figure 2
Larger initiatives account for a significant proportion of projected infrastructure investment but are largely without full funding commitment
Distribution of initiatives in the Pipeline by expected initiative cost, December 2025
The view provided through the Pipeline of committed investments and unfunded investment options (or opportunity costs) is important to inform funding decisions. We are committed to working with contributors to improve Pipeline information quality and standardise and align reporting processes, including to provide more clarity in the reporting of funding status.
Initiatives entering procurement
Table 1 shows the total expected cost of initiatives by procurement timing and type of infrastructure provider. Many contributors have not yet provided procurement timing for their initiatives. This means near term procurement opportunity indicated below is likely to be understated. $11.8 Billion is reported as in procurement with 65% from Central Government initiatives.
Table 1
Breakdown of Pipeline value scheduled to enter procurement, 1 Jan – 31 Dec 2026
All values are recorded in $ billions.
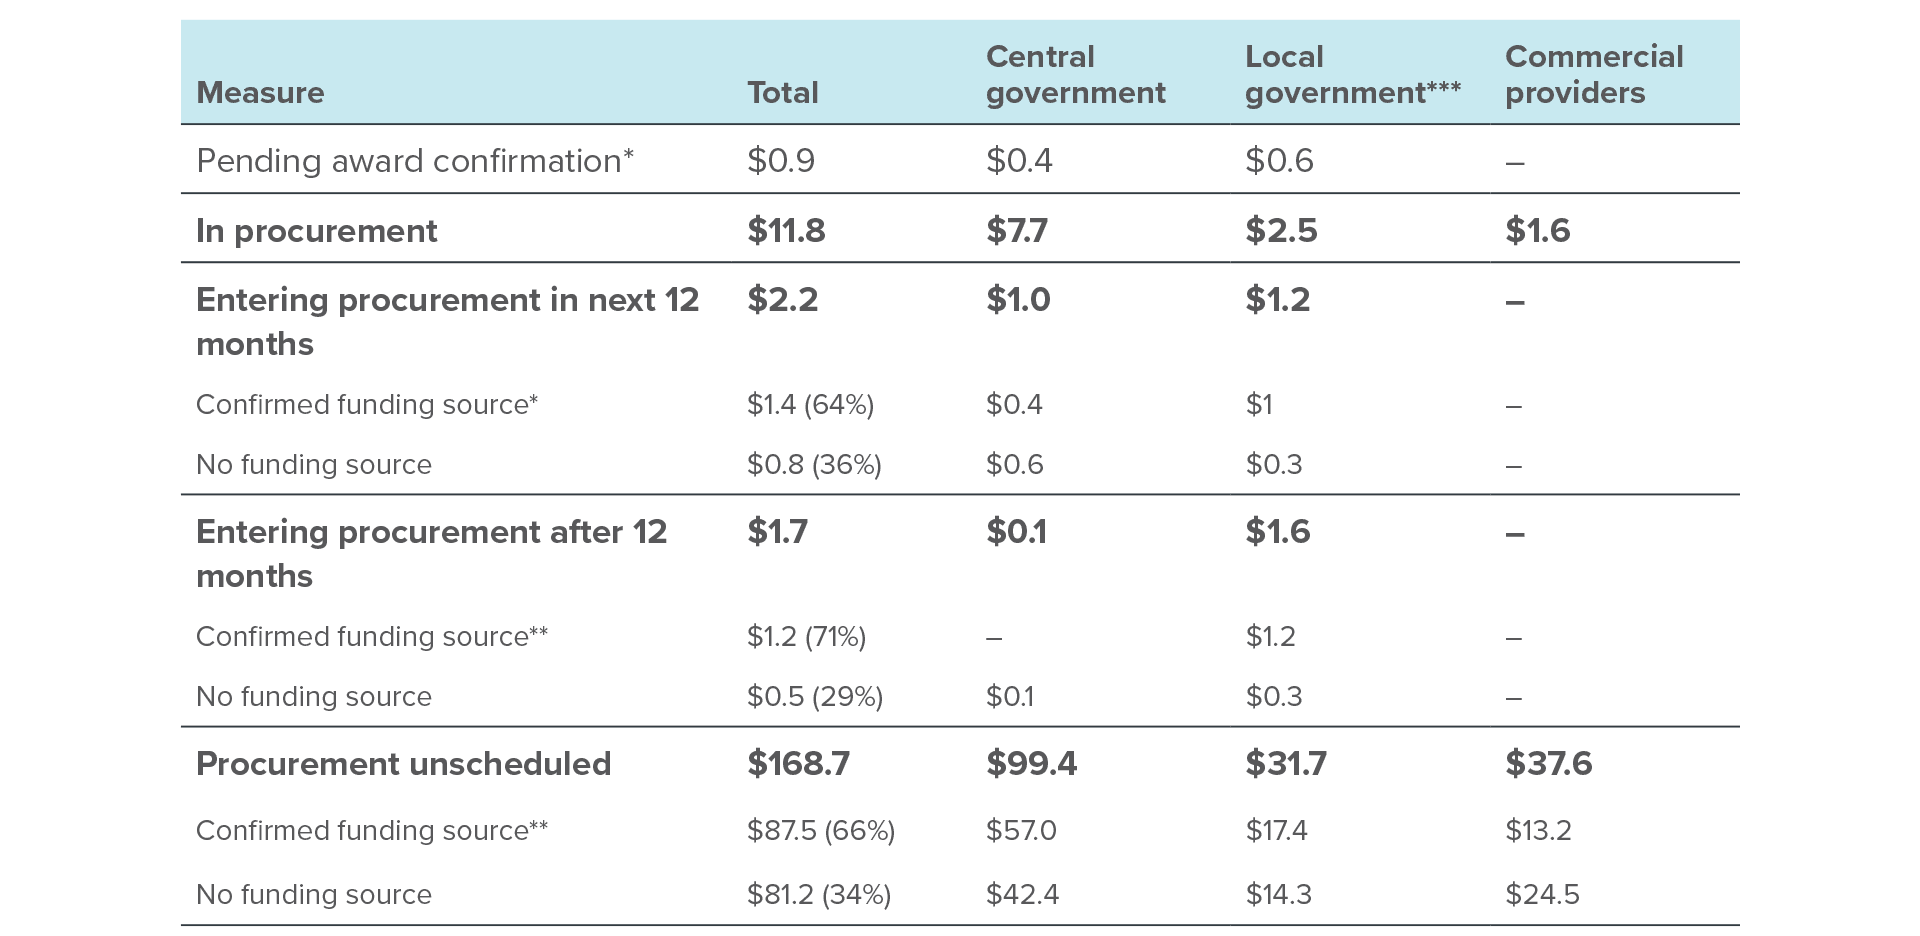
* Includes initiatives where the scheduled procurement start date is during the last three months and indicates procurement will have started, but has not been reflected in the project life cycle status. ** Includes initiatives recorded with a funding status of ‘Fully funded’, ‘Part funded’, and ‘Funding source confirmed’. *** Local government includes local and regional council contributors as well as Auckland Transport, Watercare and Wellington Water. The Commission continues to work to standardise our classifications.
Initiatives entering construction
Table 2 shows the total expected cost for projects in the Pipeline that were under construction at the time of the update, and when other initiatives are expected to enter construction. These numbers provide a point-in-time view, and change as projects progress, new initiatives are added, completed, or closed, begin construction, or have indicative or expected construction start dates updated, added, or removed.
The table also highlights the progression of funding commitments, with most near-term activity having a confirmed funding source. As projects advance, funding is committed and contracts are awarded, improving the certainty of construction start dates. Where projects were expected to have started construction, but confirmation is still pending, this value is now shown separately in its own row.
Table 2
Breakdown of Pipeline value scheduled to enter construction, 1 Jan – 31 Dec 2026
All values are recorded in $ billions.
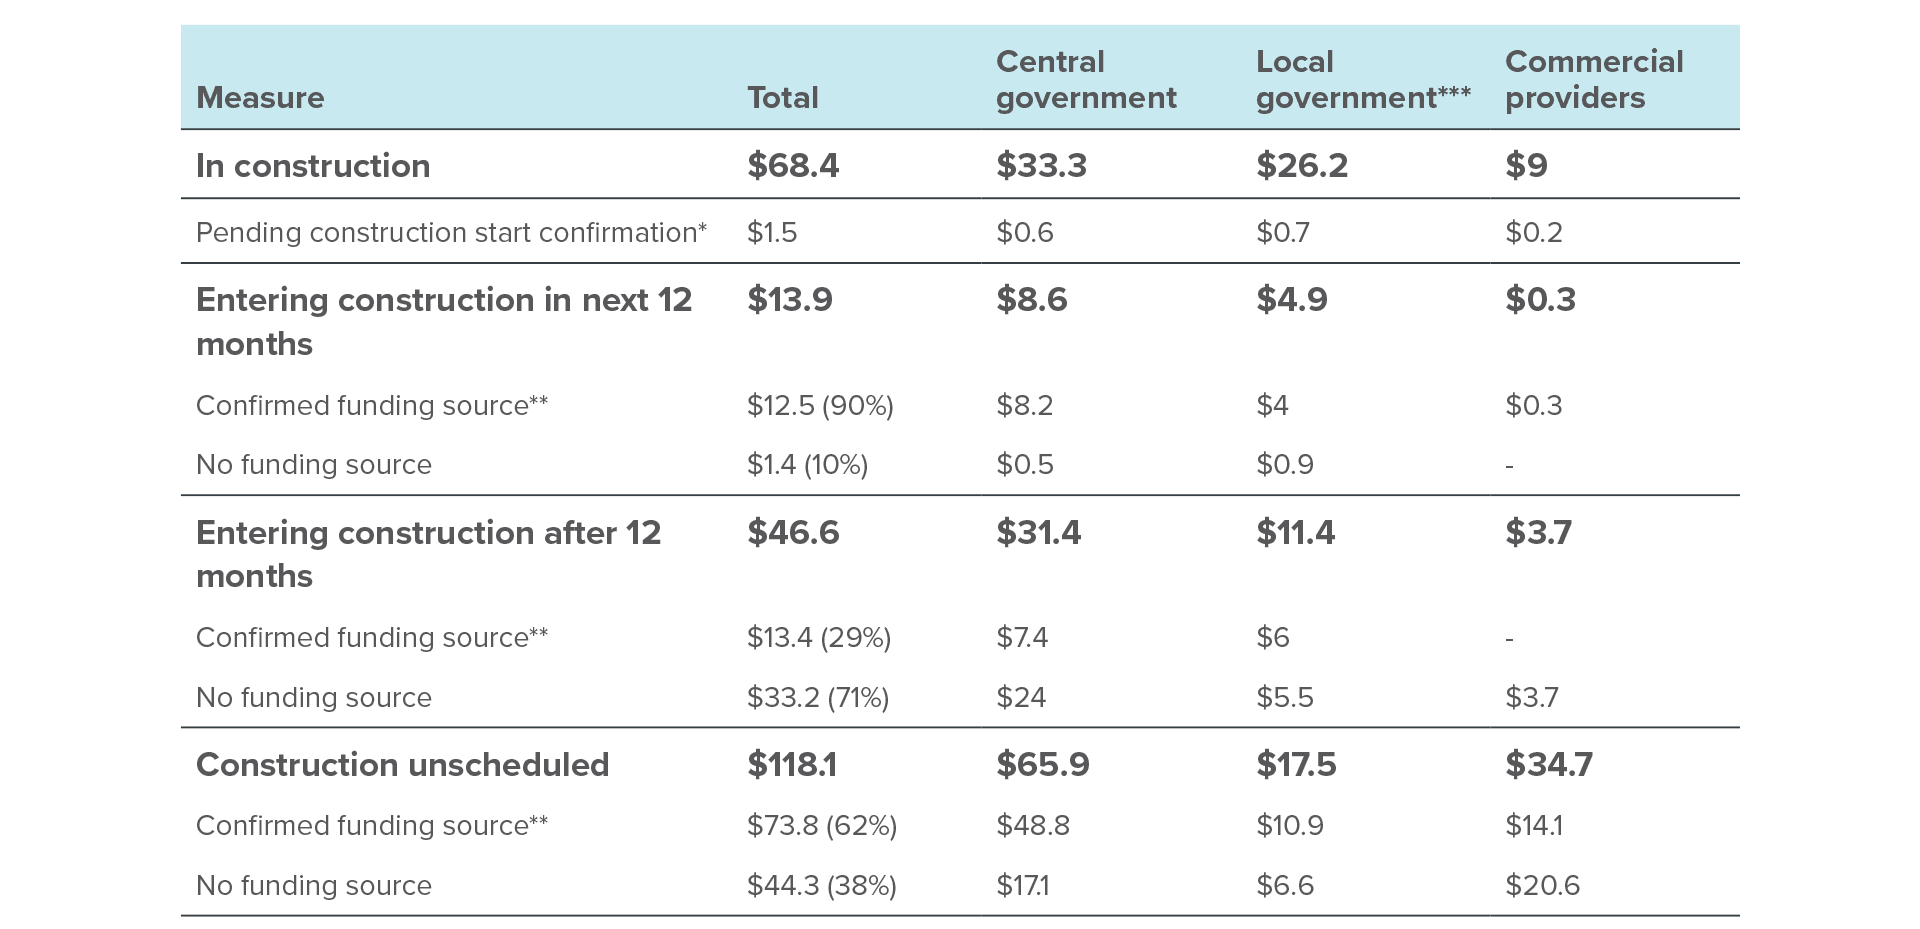
* Includes initiatives where the scheduled procurement start date is during the last three months and indicates procurement will have started, but has not been reflected in the project life cycle status. ** Includes initiatives recorded with a funding status of ‘Fully funded’, ‘Part funded’, and ‘Funding source confirmed’. *** Local government includes local and regional council contributors as well as Auckland Transport, Watercare and Wellington Water. The Commission continues to work to standardise our classifications.
Projected spend and workforce demand
Each quarter we model the projected spend and future workforce demand for the delivery of initiatives in the Pipeline that are in planning and delivery (initiatives reported as ‘under review’ and ‘on hold’ are excluded). The projections continue to evolve as investment commitments progress, projects are adjusted, scheduled, and completed, new projects are planned and added, and as new contributors provide project information to the Pipeline.
Spend over time to deliver Pipeline initiatives
Initiatives with committed or confirmed funding sources
The December 2025 update indicates a total projected spend of $21.4 billion in 2026 for Pipeline initiatives with committed or confirmed funding sources. Commission research indicates over the last 20 years, New Zealand spent an average of 5.8% of gross domestic product (GDP) on infrastructure. The $21.4 billion in projected spend for 2026 equates to around 4.9% of GDP and highlights the completeness of infrastructure activity included in and explained by the Pipeline in the near term.
The projected spend for these initiatives for 2027 is currently $14.2 billion. Near-term projected spend figures generally rise each quarter as initiatives with short planning horizons are planned and submitted to the Pipeline, and as funding commitments progress.
Our projections indicate three quarters of spend for initiatives with committed or confirmed funding sources will occur within around five years. This measure is down slightly on last quarter, indicating more focus from contributors on near-term projects. This measure provides a benchmark of how far ahead we are making commitments in aggregate across the Pipeline.
Building a stronger forward view – all funding statuses
The inclusion of unfunded initiatives (often in early planning stages) supports a transparent longer-term view of expected activity, and is a powerful tool to support scheduling and assessment of project deliverability, planning investment in workforce and capability, and funding and policy decisions.
The shape of the projections reflects both transparency of future spend and that certainty naturally decreases over the planning horizon (for example small projects are not planned with 10-year lead times). This shape also varies across infrastructure sectors and is influenced by factors such as the relative size of an individual initiative to the size of the market, initiative scope, and initiative complexity.
- Figure 3: Projected spend by funding status, shows spend with the relative split of funding commitment over time. Large, committed projects drive spend further forward into the future, while the remainder of projects wait on investment decisions.
- Figure 4: Projected spend by initiative status, for all funding status shows a similar trend to Figure 3: and highlights the improving visibility of lower-certainty initiatives across the planning horizon.
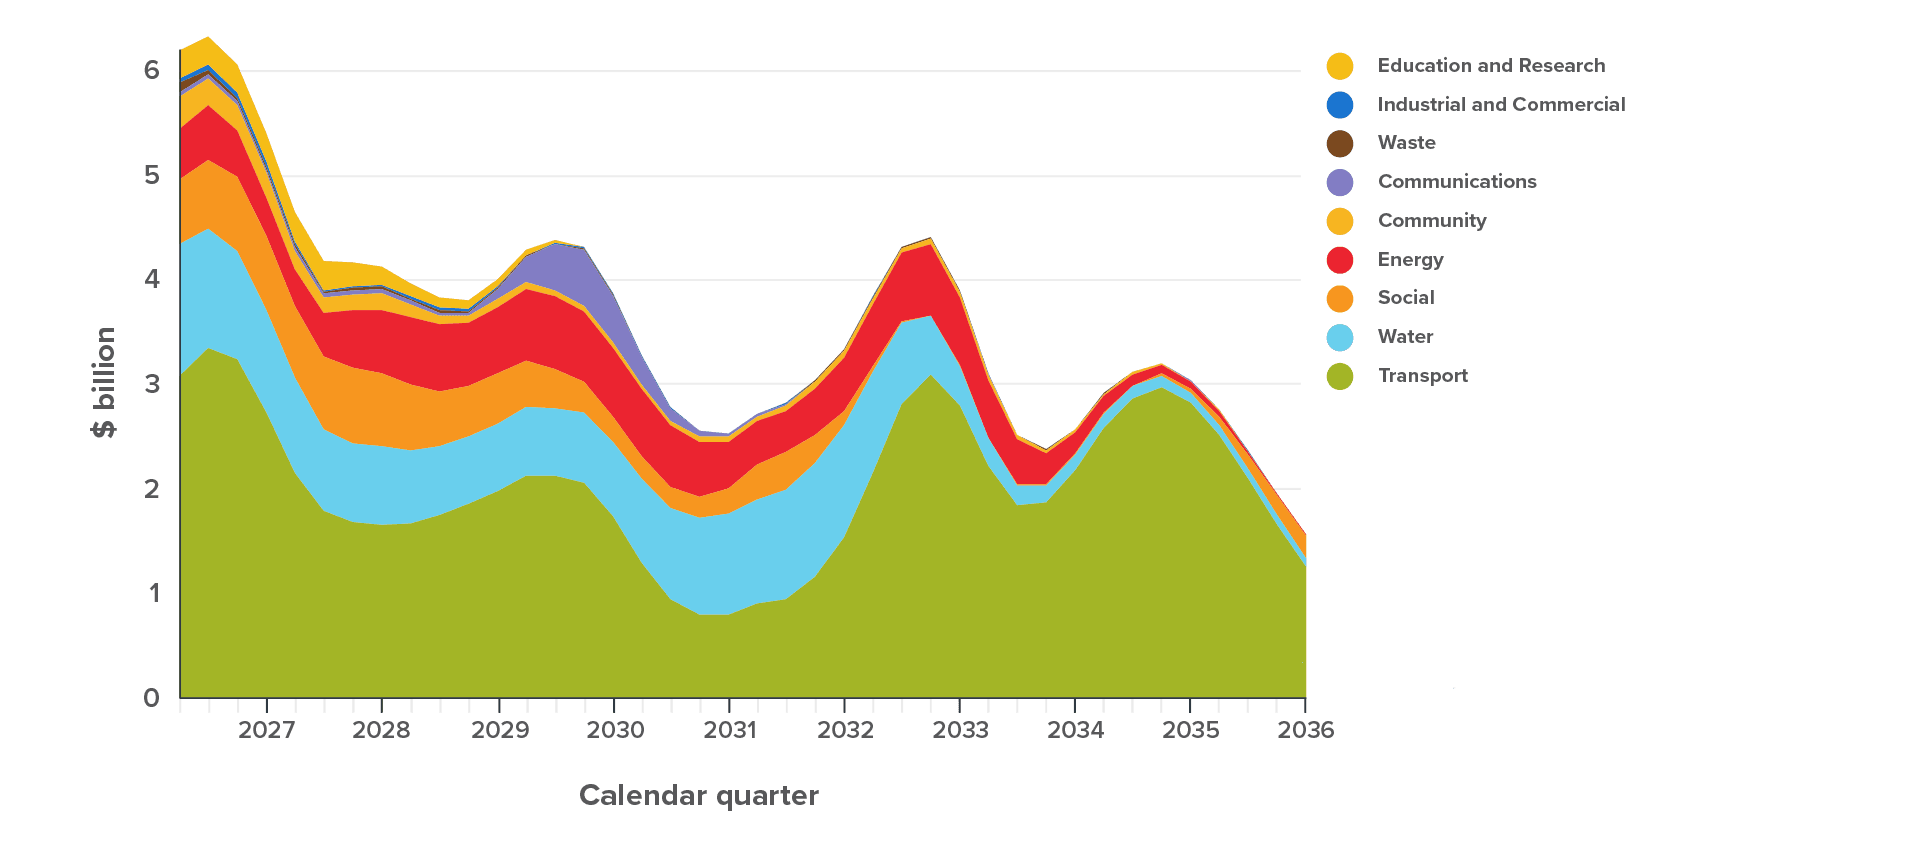
- Figure 5: Projected spend by infrastructure sectors, for all funding status shows the transport sector (including road, rail, ports, and airports) continues to dominate the Pipeline over the next 10 years. In 2026 transport spend accounts for $12.4 billion or 52% of total projected spend. Annual spend for all initiatives in this sector remains above $7 billion across the 10-year projection apart from in 2030 and 2031 when the projected spend is under $5 billion. From 2026–2036 the total projected transport spend is $80.7 billion or 56% of spend across all sectors. The water sector accounts for $4.4 billion or 18% of projected spend in 2026. Projected annual spend in the water sector fluctuates between $2.6 billion and $4.4 billion between 2026 and 2032 and, based on current submitted information, drops to $0.8 billion in 2033.
Figure 3
Over half of projected spend in the next ten years is funded or has a confirmed funding source
Figure 3: Projected quarterly spend by funding status, January 2026 – December 2035
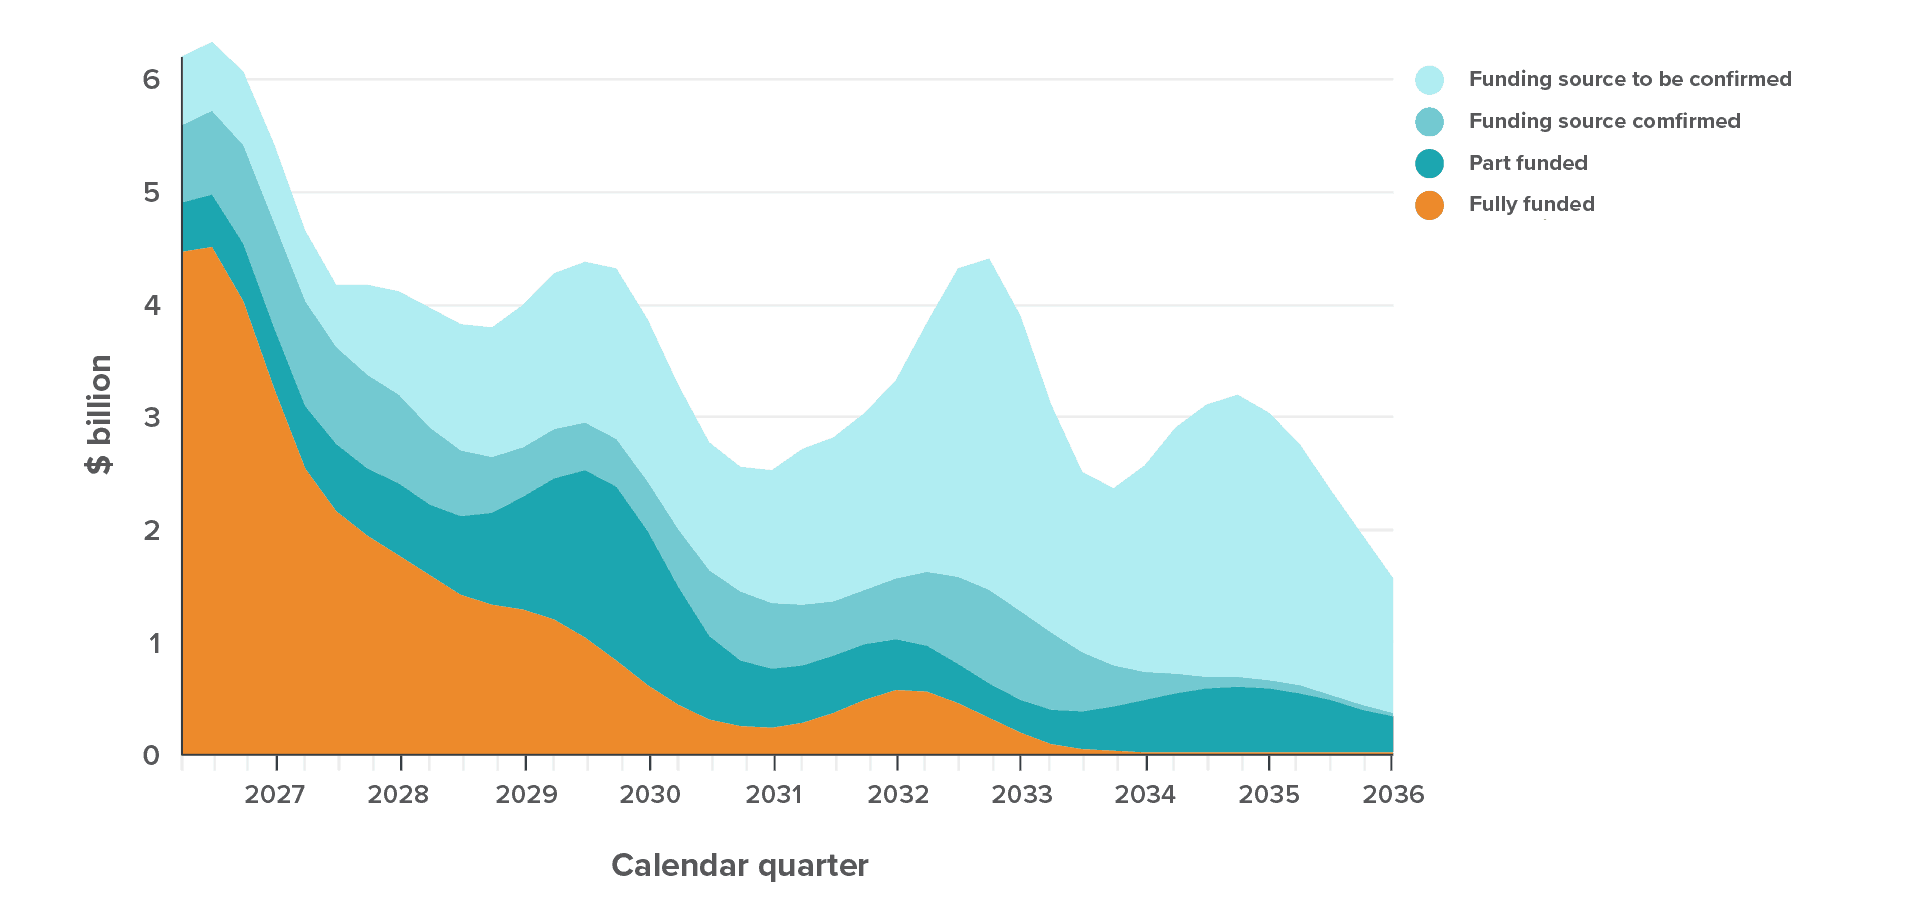
Figure 4
Most unfunded spend comes from initiatives in early planning stages
Projected quarterly spend by initiative status, all funding statuses, January 2026 – December 2035
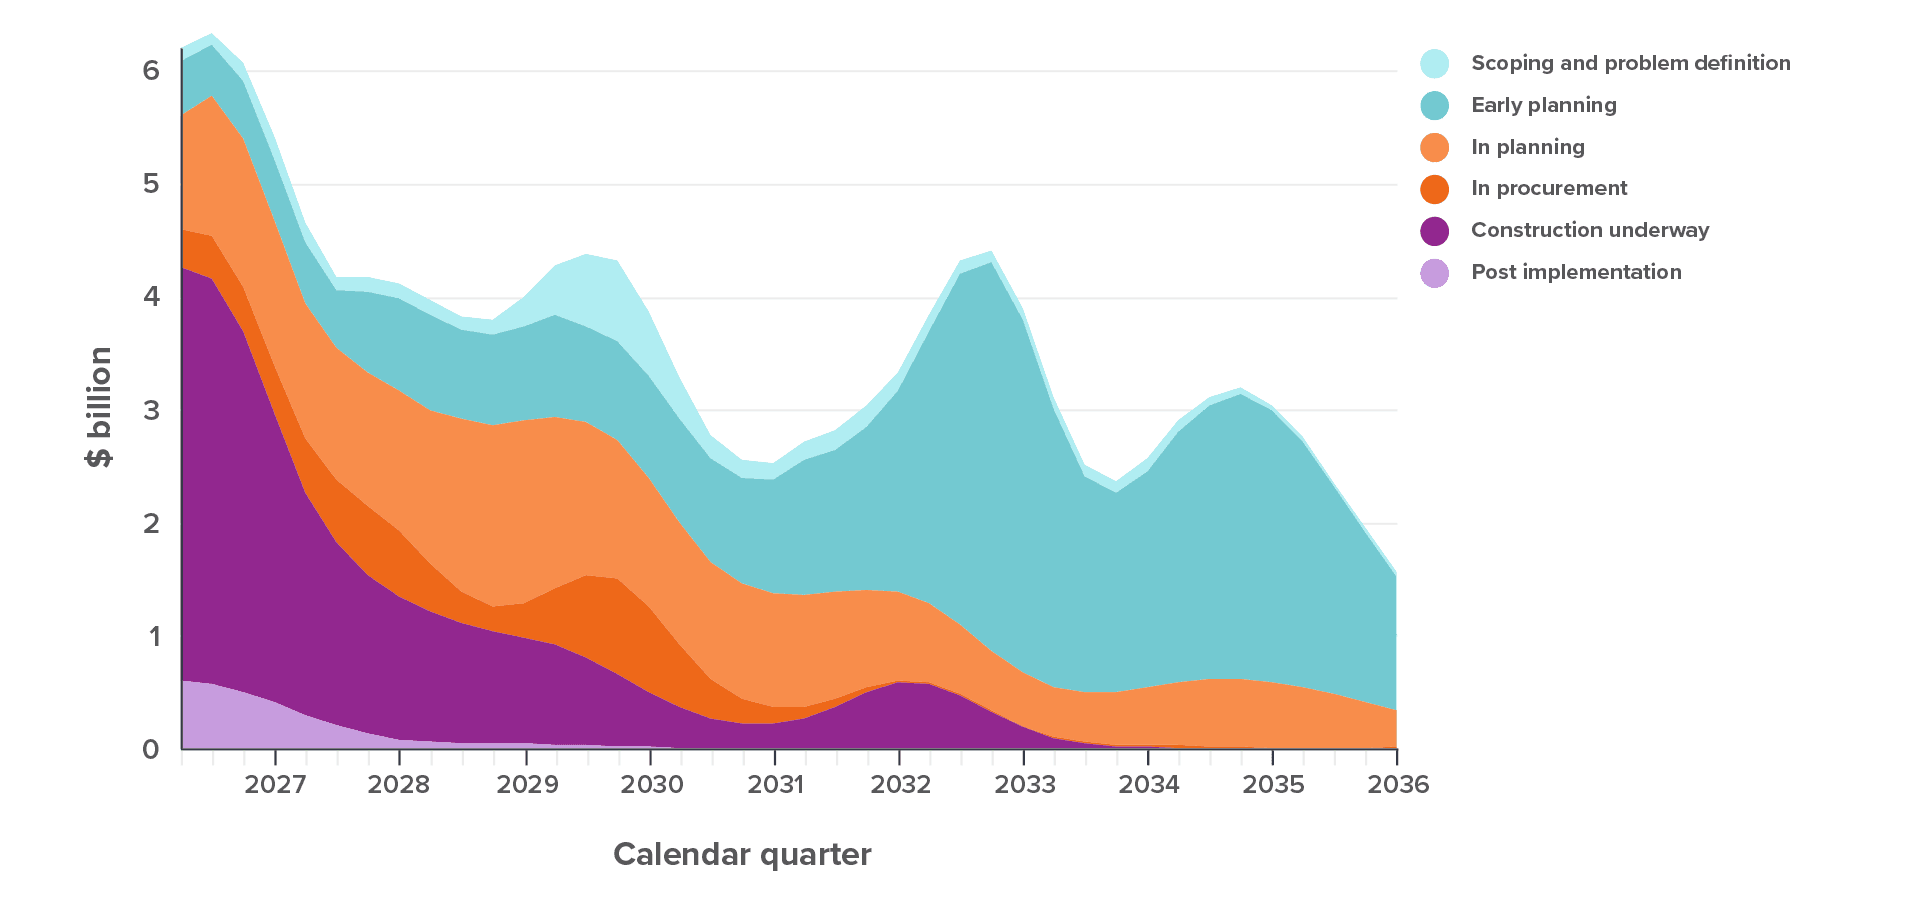
Figure 5
Transport sector spend is projected to dominate infrastructure investment over the next ten
years
Projected quarterly spend by sector, all funding statues, January 2026 - December 2035
The workforce needed to deliver the Pipeline
An early view of workforce demand (and measures of certainty) is important for planning, coordination, and scheduling of work. It helps training institutions, the construction sector, and regions to make informed decisions on investments in developing the skills and workforce that will be needed.
The infrastructure workforce is part of the wider construction workforce, much of which is dominated by housing construction activity. Around one third of the construction workforce is employed within the infrastructure sector.
Figures 6 and 7 present different views of the projected infrastructure full time equivalent (FTE) workforce required to deliver Pipeline initiatives5. A 2023 benchmark for the estimated infrastructure workforce size (supply of workforce) is included as a reference. Labour markets are dynamic by nature, and supply will have changed from 2023. However, the 2023 reference line provides a useful indication of where there may be available workforce capacity in the market, or where delivery may become constrained due to excess workforce demand. A gap between the 2023 supply benchmark and forward demand projections does not represent a drop in demand for workers. The Pipeline does not yet cover all infrastructure activity within New Zealand and as a result, these projections may understate demand.
- Figure 6: Total Pipeline workforce demand by all occupation groups, shows the continued progress in growing Pipeline’s coverage where, in the near term, the demand projections for all projects unfunded and funded are nearing the 2023 supply baseline in the near term.
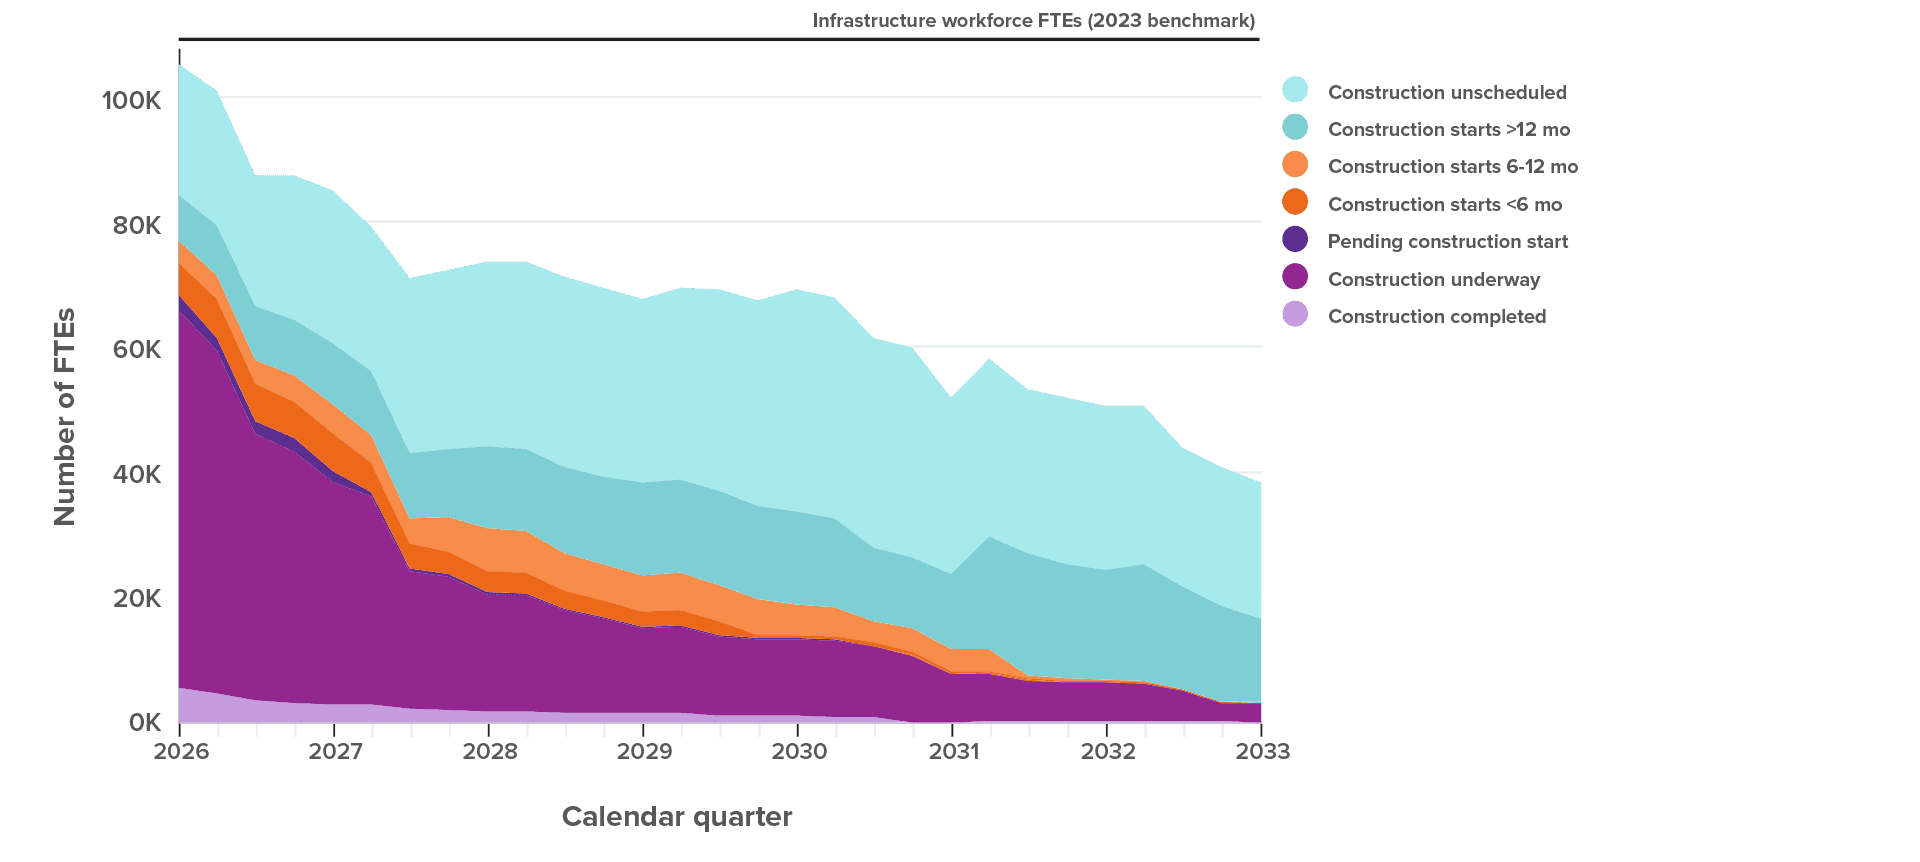
- Figure 7: Workforce demand from projects scheduled to enter construction. This figure highlights demand over time from projects that are currently scheduled to enter construction in 2026.
These projections will continue to evolve as initiatives receive investment commitments, construction start dates are populated and updated, and as initiatives are added to the Pipeline or completed. Follow the chart links below to our insight platform and login to generate more insights for your region, sector or industry.
Figure 6
Projected workforce required to deliver initiatives in the Pipeline
Projected demand for workers (FTEs) each quarter, by occupation group, New Zealand (all funding status), Jan 2026 – Jan 2036
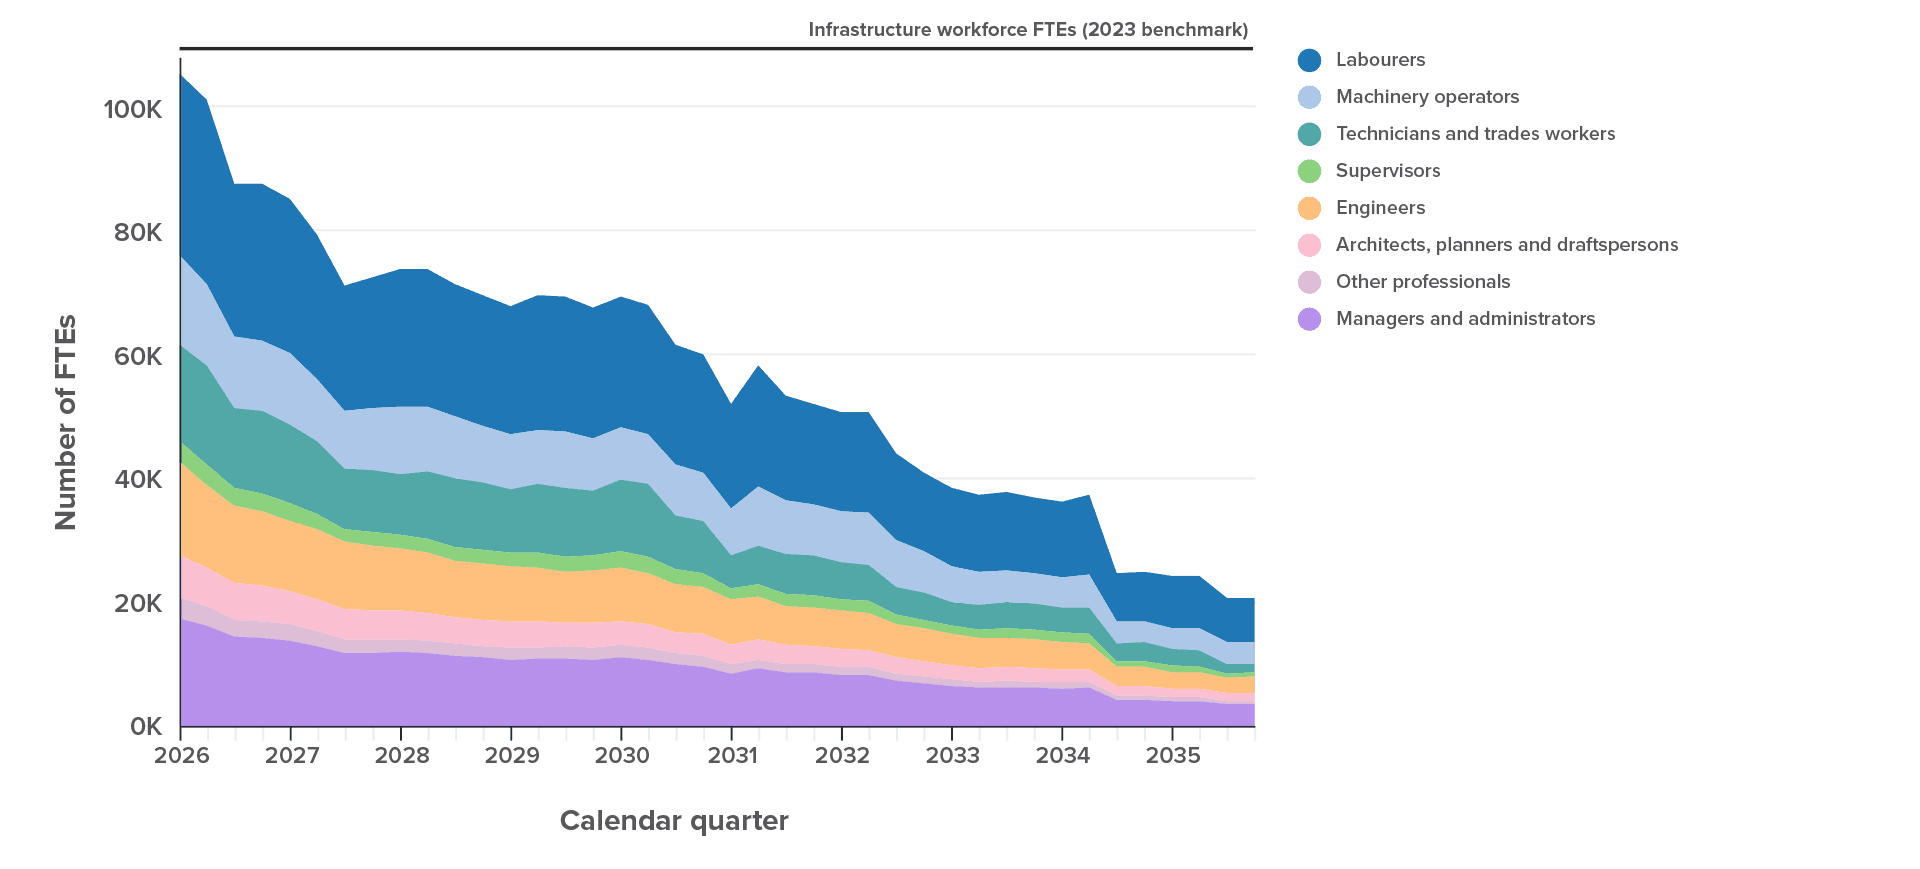
Figure 7
Workforce demand from initiatives scheduled to enter construction
Projected demand for workers (FTEs) each quarter, by construction start status (all funding status), New Zealand, Jan 2026 – Jan 2033
Unpacking the change in value between quarters
Lifting Pipeline contributors’ submission quality
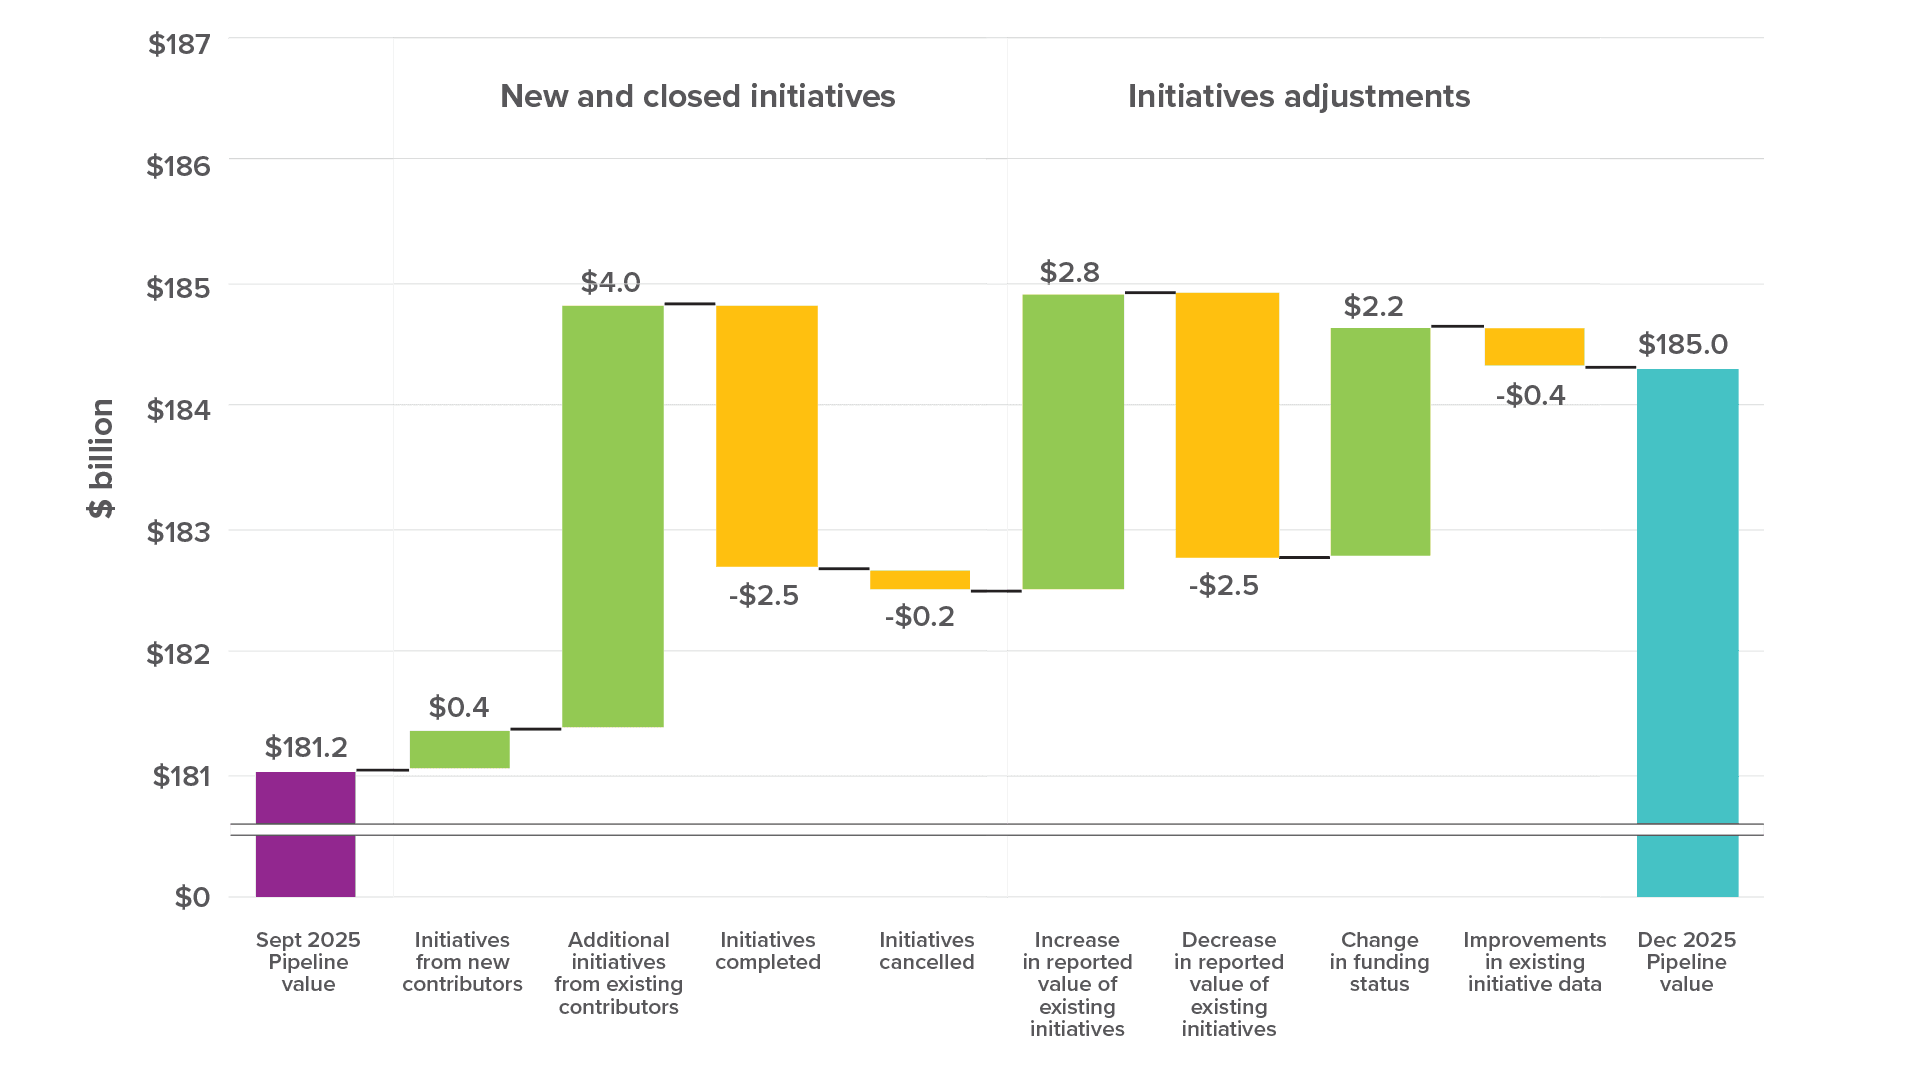
Together, the value of initiatives with full funding, part funding, or a confirmed funding source, increased by $3.8 billion to reach $185 billion in December. Alone, the value of initiatives reported with full funding increased by $3.6 billion to reach $85.8 billion. Key changes are highlighted in Figure 9 and included:
Progression of funding status
- $2.4 billion of initiatives progressing from having no confirmed funding source to having a confirmed funding source (including $0.4 billion of initiatives that progressed directly to fully funded).
- $2.9 billion of initiatives with part funding or a confirmed funding source progressing to fully funded.
New value added
- $4.4 billion of new initiatives with a confirmed funding source being added to the Pipeline (including $2.5 billion of fully funded initiatives).
Completions and reductions
-
Balancing the net changes were initiatives that were completed, those reported with a reduction in expected costs, or where the initiative funding status was downrated to ‘funding source to be confirmed’.
Figure 8
The total value of initiatives with a confirmed funding source increased due to new initiatives added to the Pipeline, increases in expected initiative cost, and initiatives’ funding status progressing
Changes in Pipeline value for initiatives with confirmed funding sources, Sept 2025 – Dec 2025
Total value in the Pipeline decreased by $7.4 billion
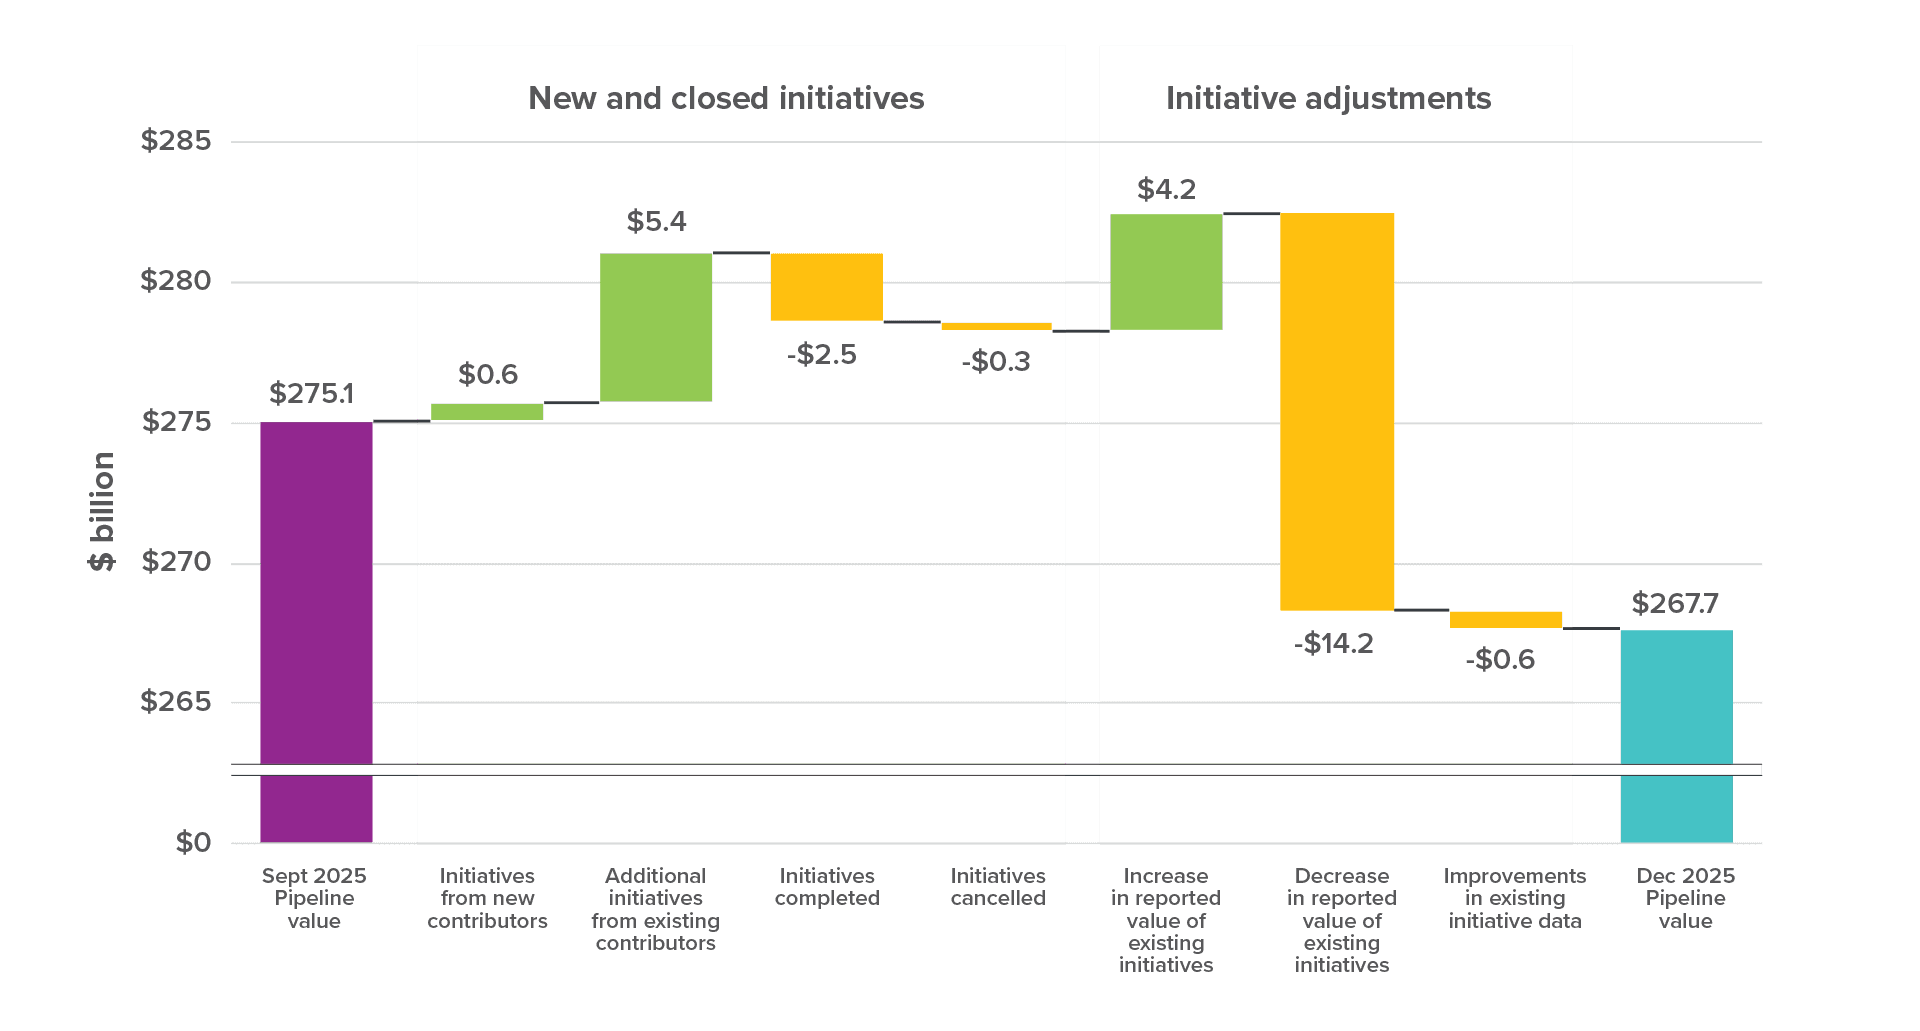
The total value of the Pipeline (inclusive of initiatives without confirmed sources, and regardless of initiatives’ progress through the project lifecycle) decreased from $275.1 billion to settle at $267.7 billion in December. Key changes are highlighted in Figure 10 and included:
Increases in total Pipeline value
- $6 billion of additional initiatives including:
- $0.6 billion provided by new organisations
- $5.4 billion from existing contributors
- $4.2 billion from adjustments to the expected cost of existing initiatives
Decreases in total Pipeline value
- $2.5 billion from initiatives completed during the quarter
- $0.3 billion from initiatives cancelled during the quarter
- $14.2 billion from adjustments to the expected cost of existing initiatives
- Quality adjustments resulted in a net decrease of $0.6 billion in Pipeline value
Figure 9
Adjustments to the expected cost of initiatives resulted in a reduction of the overall value of the Pipeline
Changes in total Pipeline value including unfunded initiatives, September 2025 – December 2025
Adjustments to expected costs of initiatives
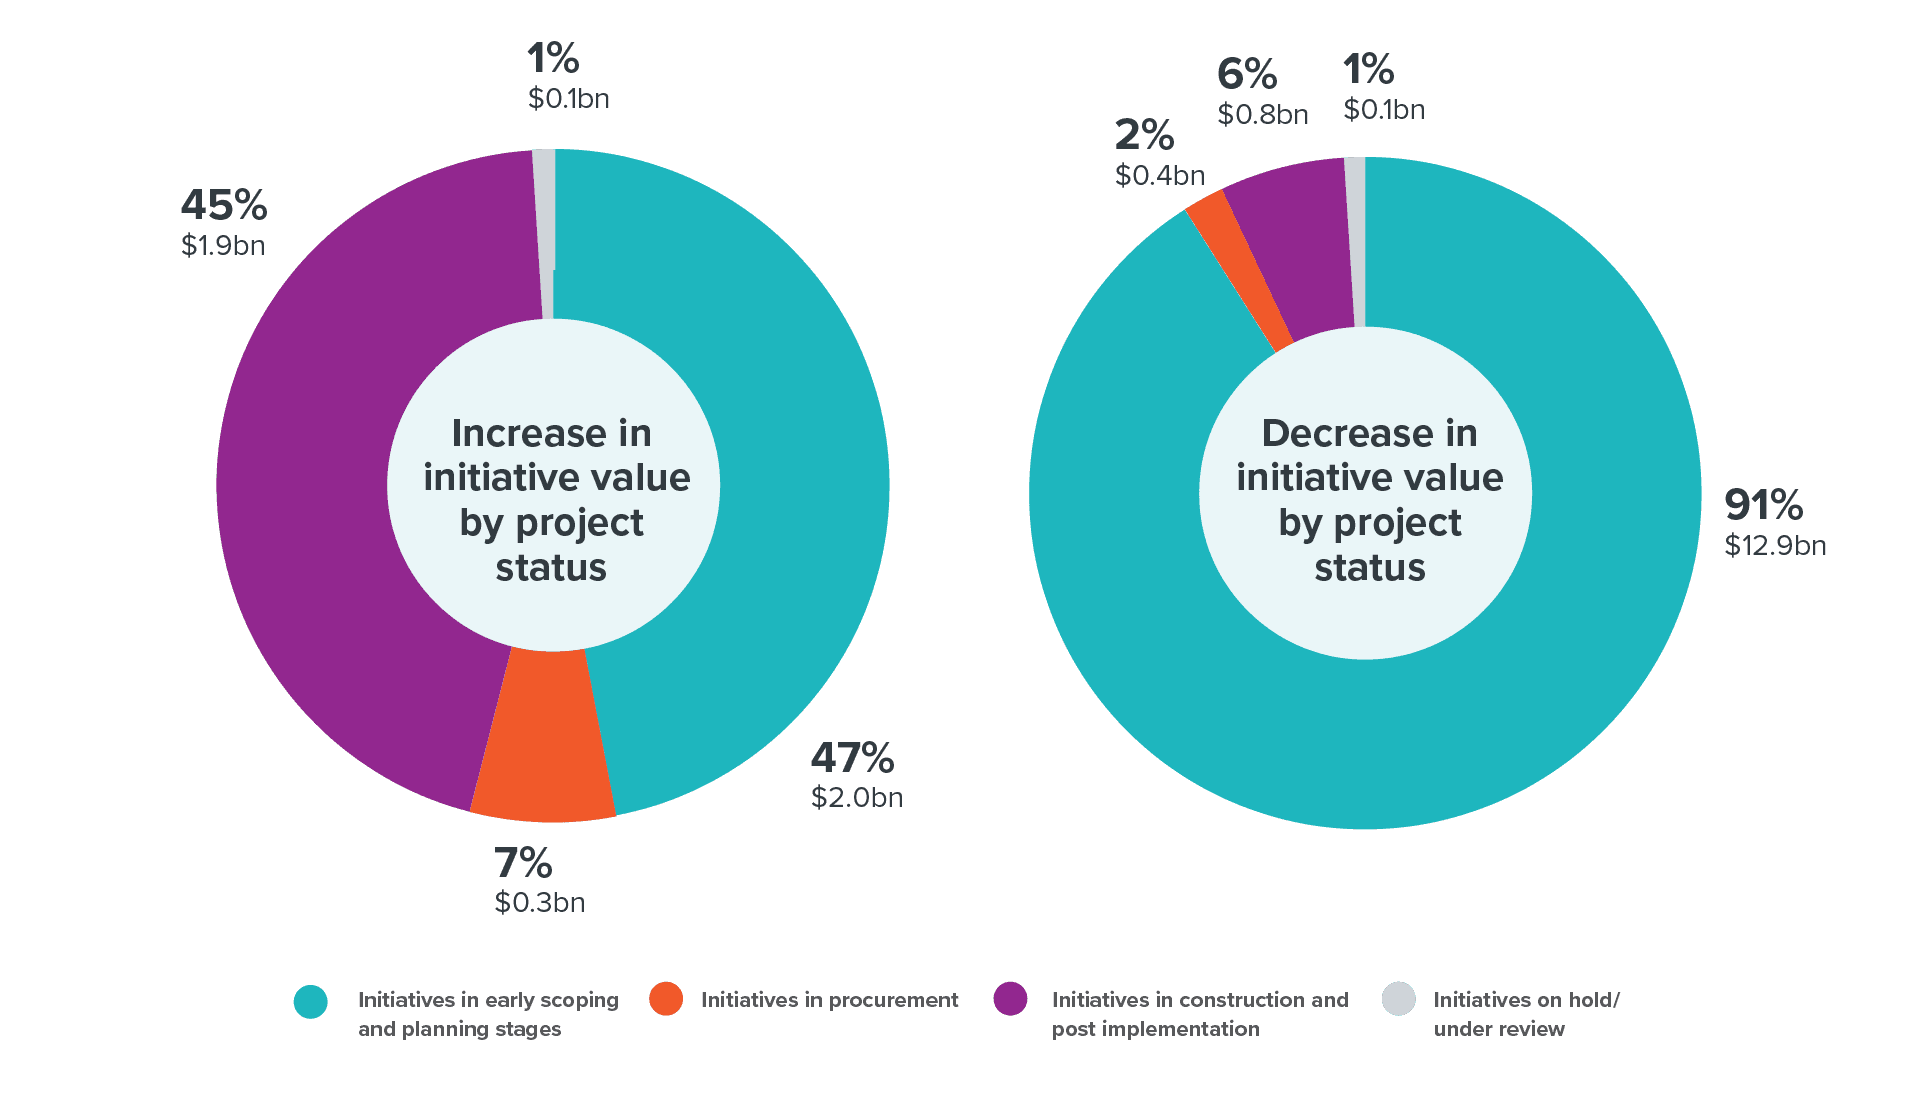
Figure 11 highlights that adjustments made to the expected costs of previously reported initiatives are a large driver of change in Pipeline value. Early planning stages are the easiest time to adjust initiatives, and we observe this through the Pipeline. Most cost estimates made in these stages typically have low-confidence. Adjustments made in
December had a net result of removing $10.2 billion in Pipeline value. Drivers of change are highlighted in Figure 11 and included:
$4.2 billion increase in expected costs
- 47% came from initiatives in early scoping and planning
- 45% came from 367 initiatives currently in construction or post implementation
$14.2 billion decrease in expected costs
- 91% came from initiatives in early scoping and planning, including significant projects from New Zealand Police and KiwiRail
Figure 10
Most adjustments in initiative value occured in planning stages
Project status for Pipeline initiatives that increased or decreased in reported value since September 2025.
Changes in initiatives’ expected costs, are often driven by a change in approach to reporting to better reflect potential costs for full initiatives, rather than by a change in initiative scope, cost increase or cost escalation. Transparent reporting of funding status provides a more accurate signal to the construction market of what is being planned, the combined volume of activity, and insights into the relative certainty of initiatives proceeding.
Towards a complete Pipeline
Te Waihanga first published the Pipeline in June of 2020 to support statutory functions required under the New Zealand Infrastructure Commission/Te Waihanga Act 2019. The Pipeline continues to build towards a trusted and complete view of infrastructure planning, investment, and construction activity in New Zealand.
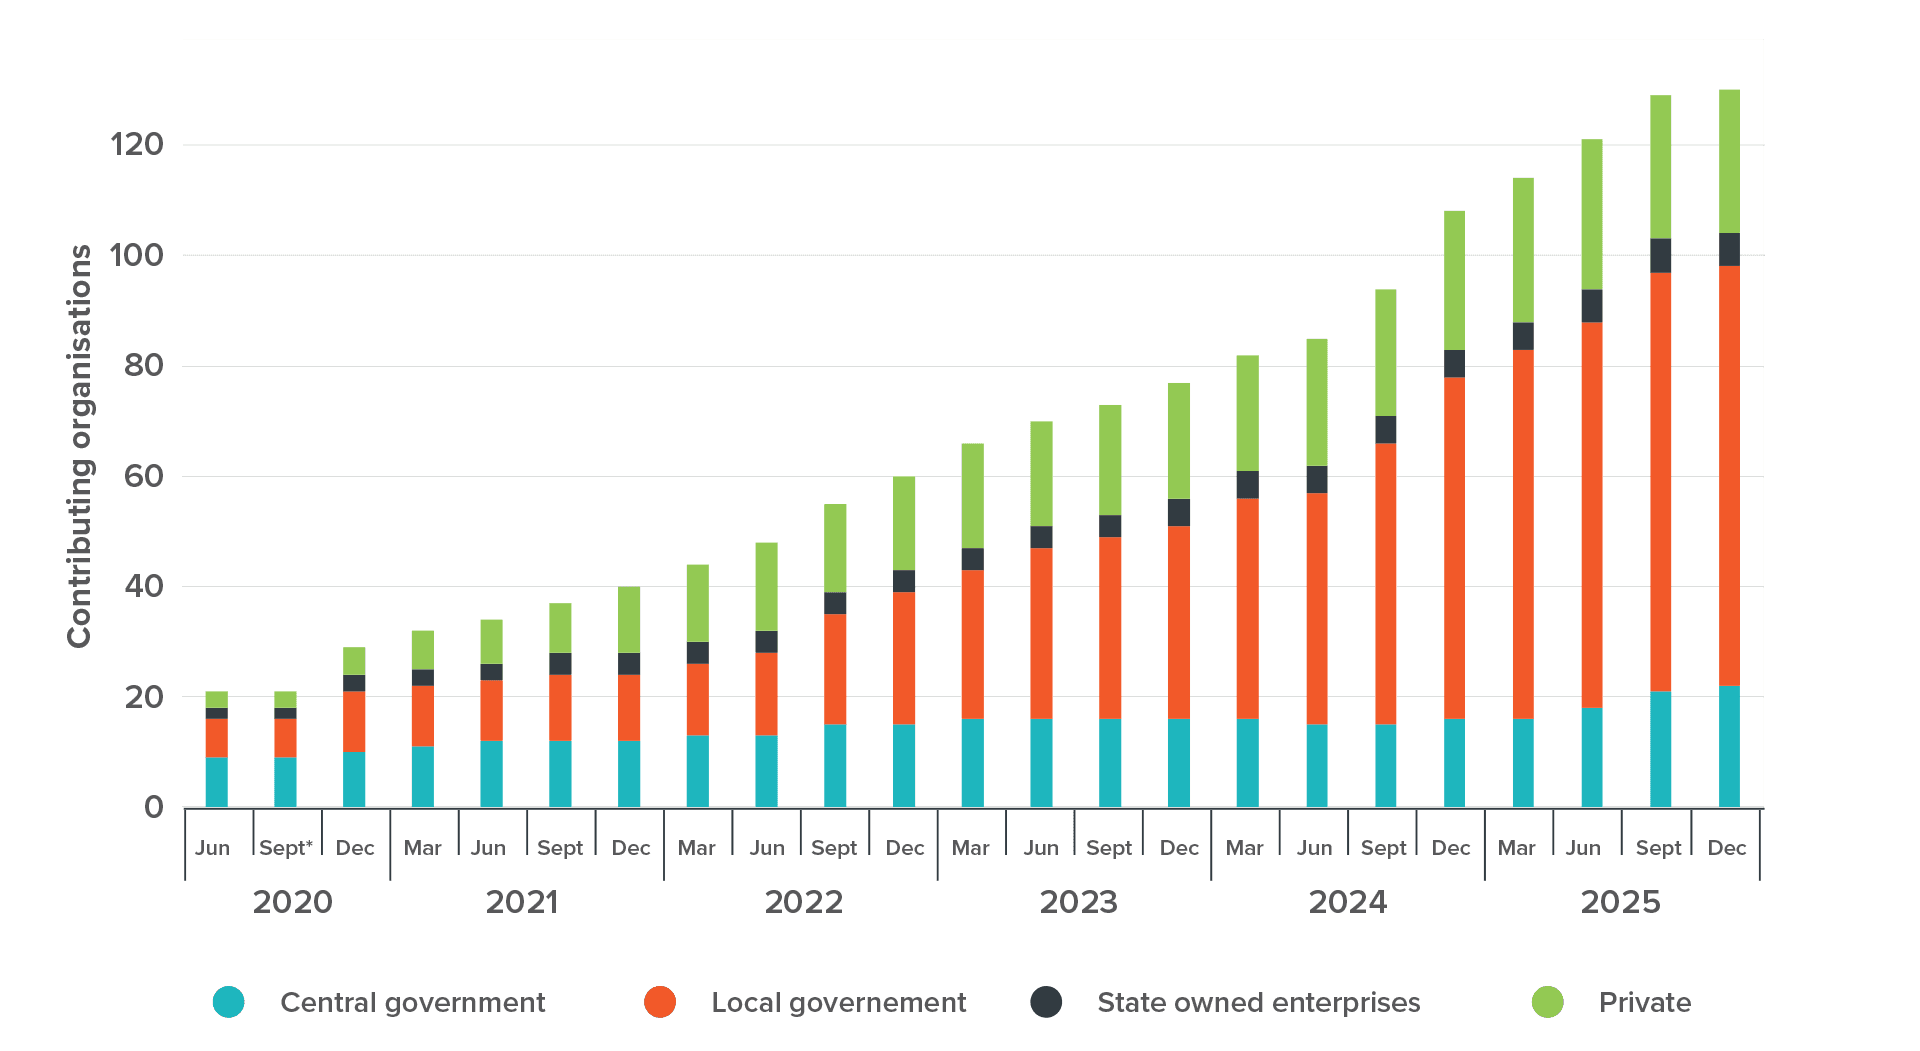
In December, 86% of our contributors provided updates, adding new initiatives, making changes or confirming their information remained correct. In addition to these updates, we welcomed Parliamentary Services as a new contributor.
In total, 130 organisations now contribute information, up 20% on 12 months ago. We thank our partners for their efforts and another step change to improving the national coverage of the Pipeline.
Figure 11
Pipeline contributors grew by 20% from 1 January 2025 to 31 December 2025
Pipeline contributors, September 2020 – December 2025 8
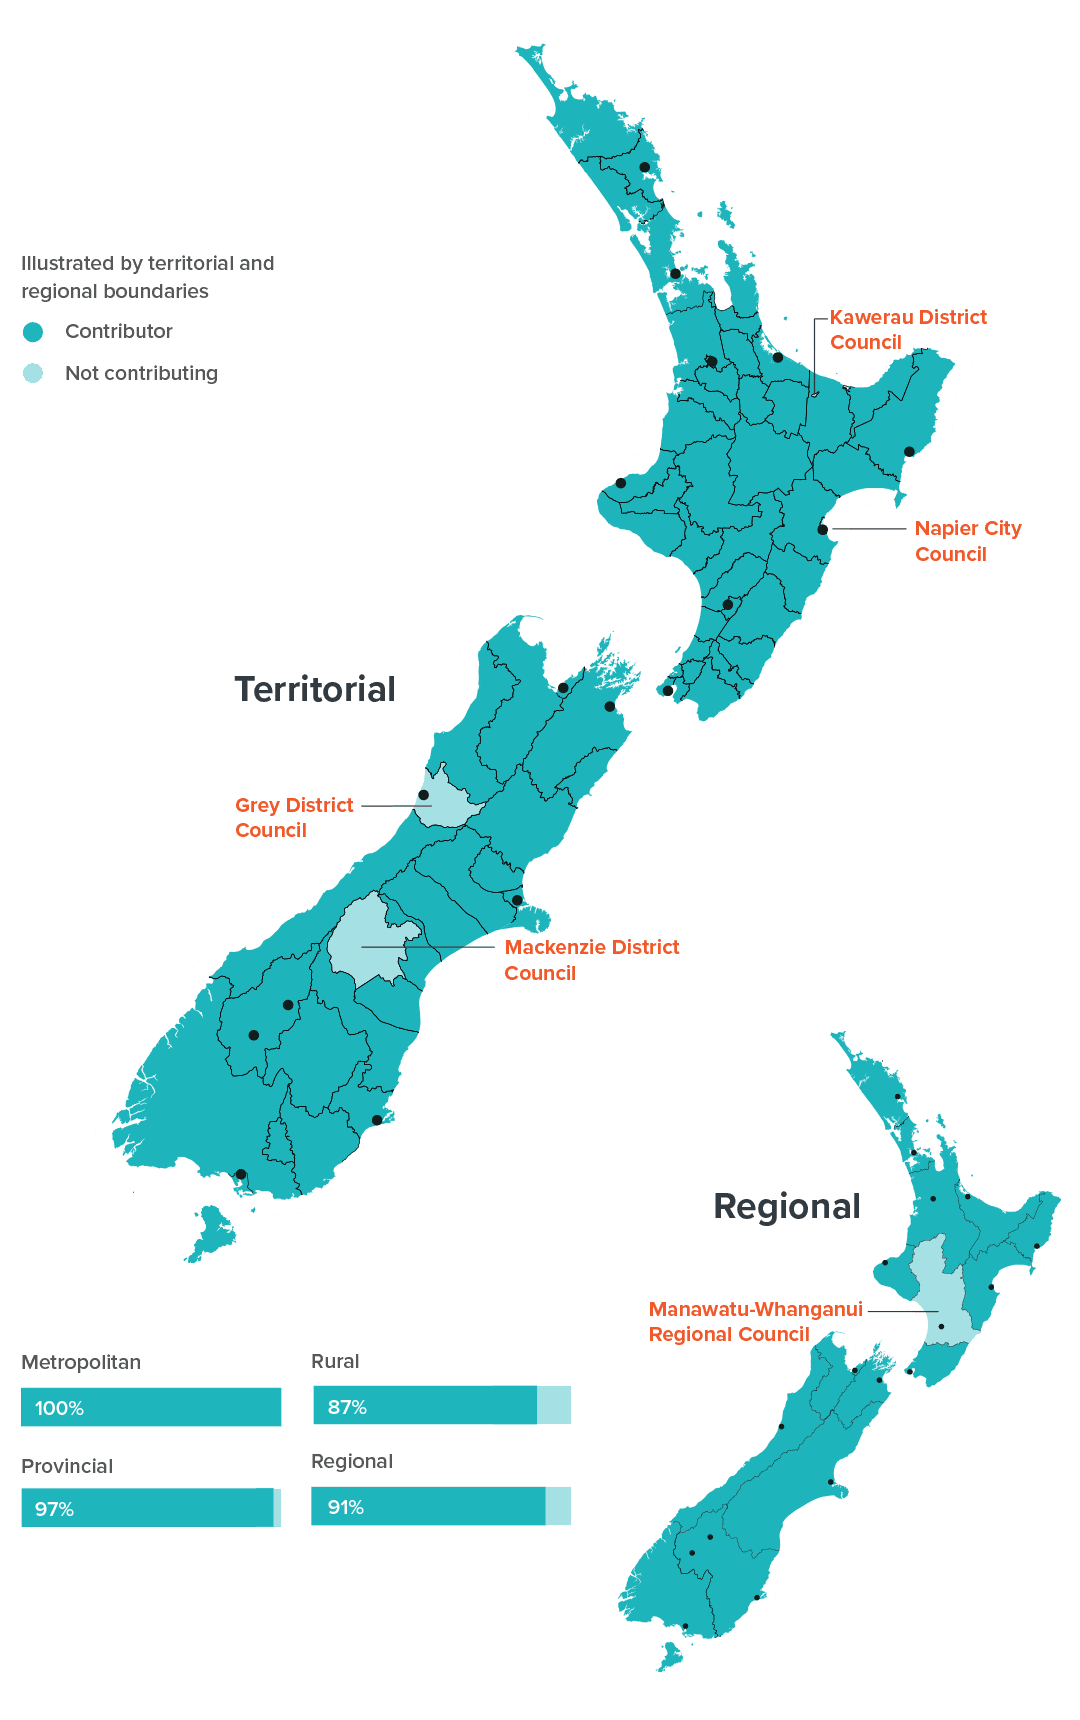
Pipeline contributors include 21 central government organisations, 6 State owned enterprises, 4 electrical lines companies covering 54% of the installation control points (ICPs) 7 and 73 councils (94% of councils across New Zealand), covering 98% of all rate revenue collected. Council contributors are illustrated in Figure 13.
Pipeline contributors include 22 central government organisations, 6 State owned enterprises, 4 electrical lines companies covering 54% of the installation control points (ICPs)8 and 73 councils (94% of councils across New Zealand), covering 98% of all rate revenue collected. Council contributors are illustrated in Figure 13 with the following councils yet to contribute:
- Grey District Council
- Kawerau District Council
- Mackenzie District Council
- Manawatu-Whanganui Regional Council
- Napier City Council
Figure 13
Nearly all councils contribute to the Pipeline
December 2025
The role of the Pipeline
The Pipeline forms an important evidence base to support a coordinated approach to infrastructure delivery across sectors, regions, and markets. Insights from the Pipeline enable understanding of investment options, opportunity costs, competing demand for construction resources and workforce, and constraints or opportunities in the market. This understanding is fundamental to promoting efficient investment in infrastructure.
The Pipeline helps inform policy development and the Commission’s advice on improvements to the wider infrastructure system, as well as Government demand-side decisions (e.g. increasing or curtailing demand through funding and other settings), and supply-side decisions (e.g. economic, education, and employment initiatives and settings).
Infrastructure providers use the forward view of infrastructure activity the Pipeline provides to inform prioritisation, coordination, planning, and investment decisions. Our stakeholders within the construction market use the Pipeline to understand upcoming business opportunities and the workforce capability and capacity that will be needed to deliver infrastructure projects. Regional economic and employment agencies use the Pipeline to understand when they need to draw skills to their region.
Join the Pipeline
If your organisation is responsible for infrastructure, and your projects are not in the Pipeline, or you are new in your organisation and want to know more, please contact the Infrastructure Commission and get your projects added and kept up-to-date via pipeline@tewaihanga.govt.nz.
Watch our Introduction to the Pipeline webinar and find out more about the role of the Pipeline, value to your organisation, submission process, and data requirements.
Introduction to the Pipeline webinar
We appreciate your support as we continue to build a complete picture of infrastructure investment and project intentions from across New Zealand.
Where to learn more
Learn more on our Insights Platform where you can gain access to a range of Pipeline insights and tools.
- Search the Pipeline, view estimated timings, and filter by project size, sector, location, and more.
- Download Pipeline information for initiatives that have not been provided in confidence.
- Uncover the workforce and occupations that would be needed to deliver the initiatives Pipeline.
View previous snapshots
Pipeline Snapshot: July - September 2025
Download
Pipeline snapshot: April - June 2025
Download
Pipeline snapshot: January - March 2025
Download
Pipeline snapshot: October - December 2024
Download
Pipeline snapshot - July-September 2024
Download
Pipeline snapshot April - June 2024
Download
Pipeline Snapshot: January - March 2024
Download
Pipeline Snapshot: October - December 2023
Download
Pipeline snapshot: July - September 2023
Download
Pipeline snapshot: April - June 2023
Download
Pipeline snapshot: January - March 2023
Download
Pipeline snapshot: October - December 2022
Download
Infrastructure Quarterly - November 2022
Download
Infrastructure Quarterly - August 2022
Download
Infrastructure Quarterly - January 2022
Download
Infrastructure Quarterly - May 2022
Download
Infrastructure Quarterly - October 2021
Download
Infrastructure Quarterly - July 2021
Download
1 The Pipeline programme includes initiatives provided in confidence. These initiatives inform aggregate totals and projected spend and workforce demand but
are not released at record level.
2 The Pipeline is a live system that is updated regularly. Our snapshot reports are based on best known information at the time of publication. This may cause differences in reported values over time and between publications.
3 Projects submitted with a project status of ‘In procurement’ and projects reported to enter procurement in 12 months from 1 January 2026.
4 Projects reported to enter construction in 12 months from 1 January 2026.
5 Our workforce modelling currently uses a different model to the spend modelling and some differences may arise because of this. Over time we will integrate these two models.
6 In Figure 11 Central government includes Crown entities; local government includes local and regional councils as well as Auckland Transport, Watercare, and Wellington Water; state owned enterprises includes mixed-ownership models; private organisations includes universities and remaining council-controlled organisations. The Commission continues to work to standardise our classifications.
7 An ICP is an installation control point or the point of connection to an electricity network where an electricity retailer is deemed to supply electricity to a consumer.